 |
| Music |
| Songs |
| Song Years |
| Song Artists |
| Song Titles |
| Song Charts |
| Albums |
| Album Years |
| Album Artists |
| Album Charts |
| Site Index |
Which pages are most often looked at on this site? |
|
Now that this site has been running for a few years it is possible to consider the pages that people access on the site as a rough indication of which topics are interesting to the readers. This page outlines some of the access levels of different parts of the site.
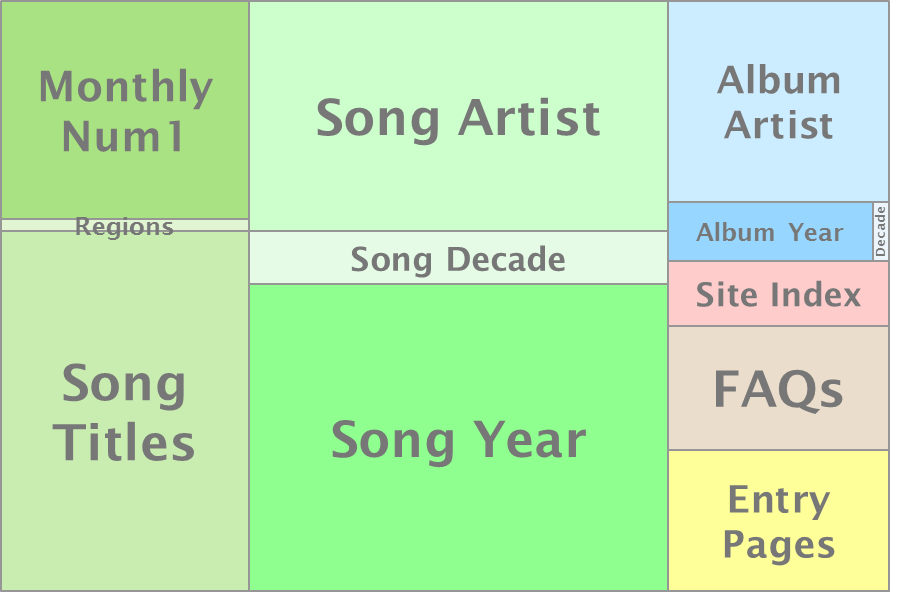
There are twelve different categories of pages on the site. The figure above shows how frequently they are accessed. The user's focus is clearly on songs (rather than albums). Interestingly users look for the songs of a particular year more that the songs of a particular artist, but they look for albums of a particular artist much more than the albums of a particular year. The high volume of traffic for the monthly number one pages surprised us, of course as purists we worry that our presentation of this data is too simplistic, most users clearly would rather have a simple picture than an accurate one.
Song Years
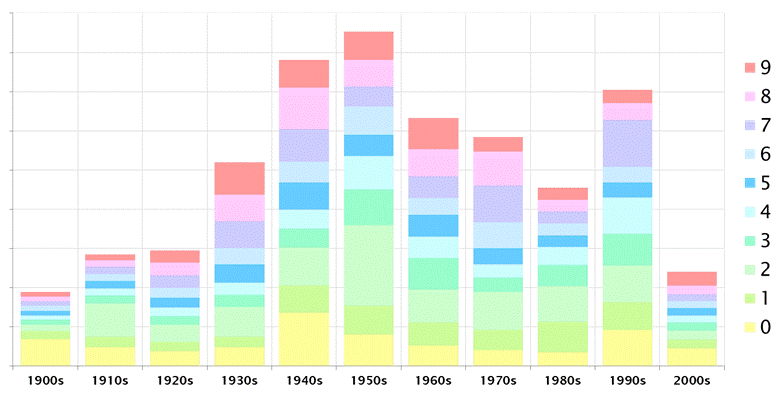
The plot above shows how many times each of the "Song Year" pages were viewed. By far the most frequently viewed year was 1952 (the third box up in the 1950s, given that was both exactly 60 years ago and also that the British Queen's Diamond Jubilee was celebrated during the period being measured that is not a surprise. The low values for the 2000s was also expected, the site is not particularly focused on (or indeed good for) music after about 2005. Also the period before the 1930s is outside most people's interests. The high overall viewings of the 1950s and 1990s are a surprise (at least to us).
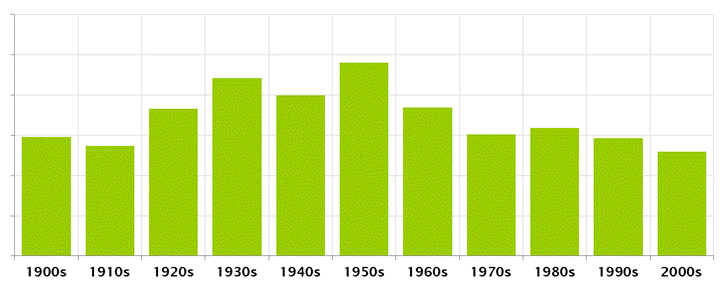
When the song decade pages are examined the peak in the 1990s is not present.
Song Artists
The following artist's pages were most commonly viewed:
Song Titles
The following song titles were the most commonly viewed:
| # | % | Title |
| 1 | 0.105% | You Belong to Me |
| 2 | 0.062% | In the Mood |
| 3 | 0.054% | When You Were Sweet Sixteen |
| 4 | 0.053% | Hold On |
| 5 | 0.053% | Over the Rainbow |
| 6 | 0.052% | Rock Around the Clock |
| 7 | 0.051% | Let's Dance |
| 8 | 0.051% | Crazy |
| 9 | 0.047% | Summertime |
| 10 | 0.047% | Buttons & Bows |
| 11 | 0.046% | Night & Day |
| 12 | 0.045% | Always |
| 13 | 0.045% | White Christmas |
| 14 | 0.045% | Hero |
| 15 | 0.042% | Alexander's ragtime band |
| 16 | 0.042% | Temptation |
| 17 | 0.042% | Swanee |
| 18 | 0.041% | I Love You |
| 19 | 0.041% | Riders in the Sky |
| 20 | 0.041% | Paradise |
Monthly Number 1 Songs
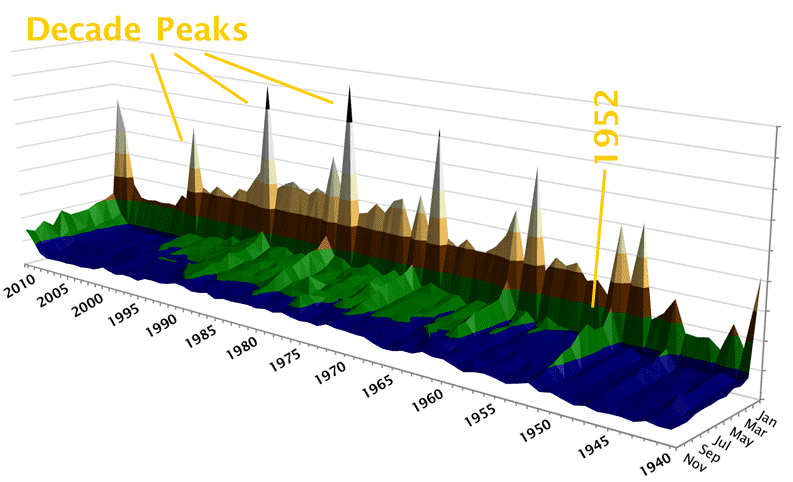
The monthly number 1s pages are much more heavily used than we had expected. The plot above shows how frequently the pages were viewed across each of the 12 month's pages for the years 1940 to 2011. The high number views of January pages is an artifact of the navigation that tends to direct people via the January pages, the decade pages (Jan 1940, Jan 1950 etc) have high counts for the same reason. The peak between 1962 and 1995 can be interpreted to show that people really do look for the months they were born (assuming most users are 18-50 years old).
Albums
The album pages are visited about one quarter as many times as the corresponding song pages.
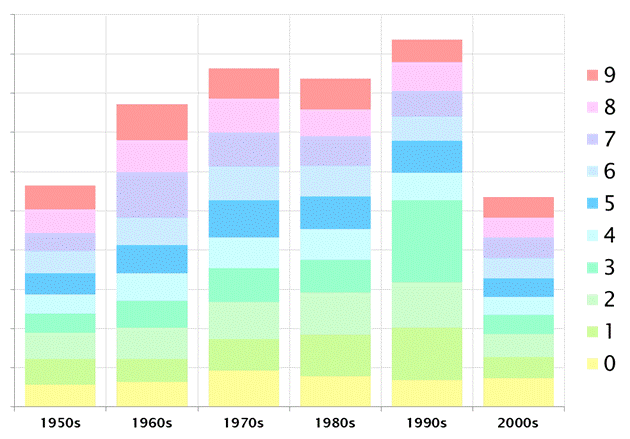
The album year pages show the same peak in the 1990s as the song years do. For some reason 1993 was very popular. The decade plot also emphasises the 1990s. The most visited album artists were:
| # | Artist |
| 1 | Chage & Aska |
| 2 | Georges Brassens |
| 3 | The Beatles |
| 4 | Genesis |
| 5 | The Beach Boys |
| 6 | Guns n' Roses |
| 7 | Michael Jackson |
| 8 | James Last |
| 9 | Elvis Presley |
| 10 | Led Zeppelin |
| 11 | Richard Clayderman |
| 12 | Engelbert Humperdinck |
| 13 | The Rolling Stones |
| 14 | Britney Spears |
| 15 | Andy Williams |
| 16 | Pink Floyd |
| 17 | Whitney Houston |
| 18 | Tori Amos |
| 19 | Frank Sinatra |
| 20 | Neil Diamond |
Why this list should be headed by what are (to us anyway) a pair of obscure Japanese and French acts is a mystery. At first we assumed these were high up because we only looked at a few day's logs, but extending the period made no difference.
General Points
As with all such reviews the impact of search engine crawlers and other web spiders have to be accounted for. When the site first started (in 2007) a large proportion of the accesses were from automated spiders. When we first started our estimate was that 90% of requests came from spiders, even as late as 2011 it was clear that this proportion was about 40%. However the significant growth in real use means that for the early part of 2012 the number is less than 7% (and continues to fall).
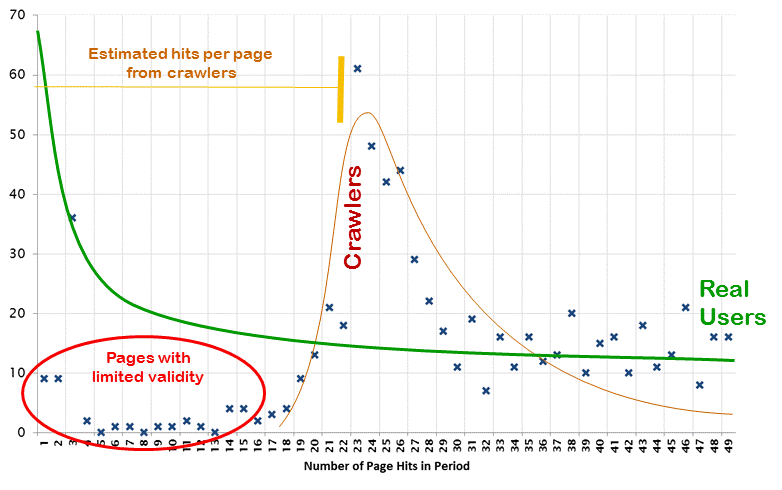
The picture above shows the number of pages that had smaller number of accesses over an extended period in the early part of 2012. The peak at 23 page views shows that many of the less frequented parts of the web site were mainly exercised by crawlers.
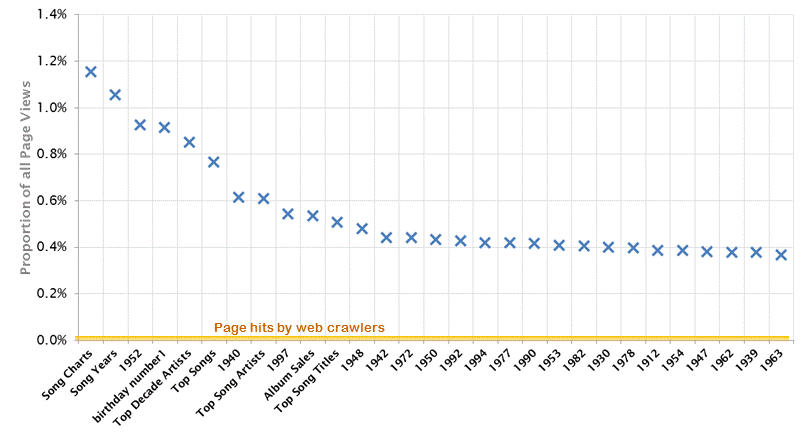
The most frequently accessed individual pages are those like the list of top songs, artists, titles and charts that are the normal way of getting into the site. As was shown above the annual song charts are the most popular type of data page. 1952 was far above all the other years, as has been mentioned above that is easy to explain. As the yellow line shows the impact of spiders on these results is so small as to be insignificant.
Here are the 50 most visited pages on the site:
Country Profile
Another question is which countries visitors come from. We used a simple country identifier to map the IP addresses of users to countries. It managed to assign countries for more than 94% of our visitors over a two month period (Aug-Sep 2010). It showed that we had visits from more than 150 different countries in that period.
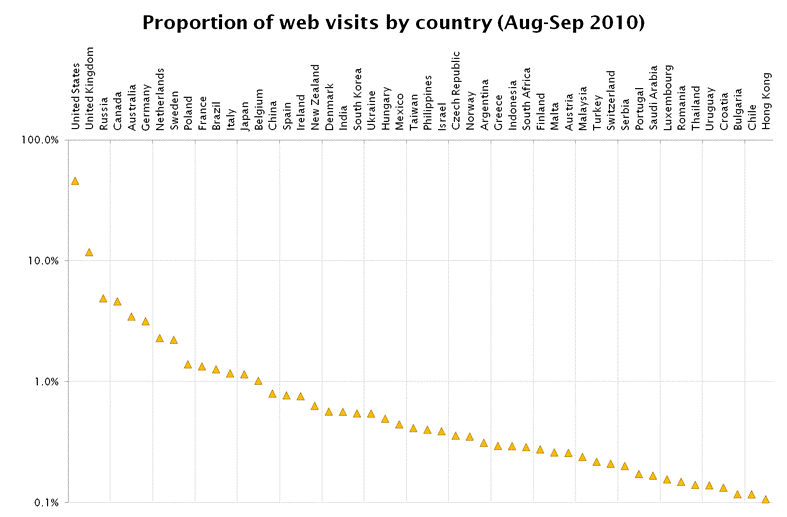
The top 50 countries are shown in the figure above. The US accounts for just under half of the activity on the site.
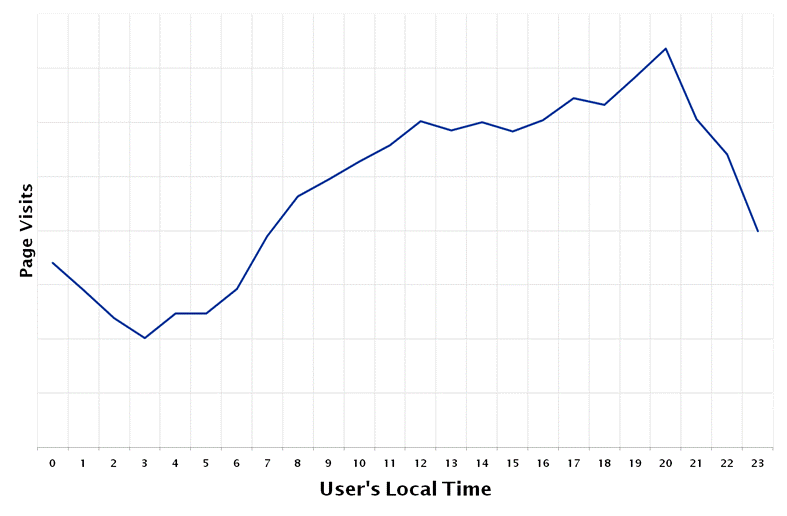
As we would expect the number of visits varies according to the time of day in the visitor's country. The plot above shows that most users look at the site in the evening (5pm to 8pm) with fewest being active at 3am.
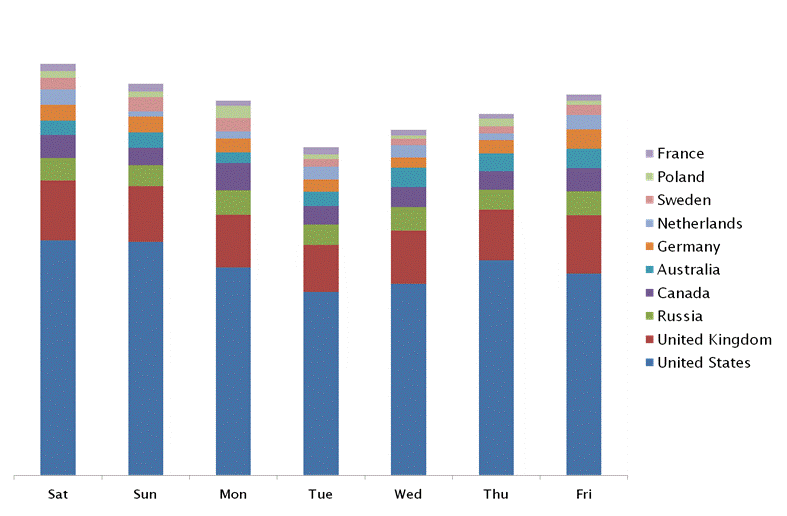
Surprisingly while the number of visits is greater at the weekend it is not that much greater. The plot above shows how the number of visits varied by week day over the two month period for the 10 most active countries.
Here is a list of the number of full page views by users within each country for a 5 month period during 2011.
| Country | Page Views | Percent |
| United States | 217667 | 41.8% |
| United Kingdom | 88019 | 16.9% |
| Canada | 35511 | 6.8% |
| Australia | 21733 | 4.2% |
| Germany | 15380 | 3.0% |
| France | 9413 | 1.8% |
| Italy | 7549 | 1.4% |
| Czech Republic | 6531 | 1.3% |
| Belgium | 5952 | 1.1% |
| Spain | 5764 | 1.1% |
| Brazil | 5484 | 1.1% |
| Russia | 5191 | 1.0% |
| Netherlands | 4926 | 0.9% |
| Philippines | 4763 | 0.9% |
| Japan | 4485 | 0.9% |
| South Africa | 4442 | 0.9% |
| Ireland | 4151 | 0.8% |
| South Korea | 4007 | 0.8% |
| Mexico | 3932 | 0.8% |
| Finland | 3719 | 0.7% |
| New Zealand | 3580 | 0.7% |
| Greece | 3245 | 0.6% |
| India | 3155 | 0.6% |
| Norway | 2679 | 0.5% |
| Malta | 2504 | 0.5% |
| Poland | 2376 | 0.5% |
| Denmark | 2339 | 0.4% |
| Sweden | 2311 | 0.4% |
| Romania | 2130 | 0.4% |
| Switzerland | 2111 | 0.4% |
| Argentina | 2054 | 0.4% |
| Turkey | 1965 | 0.4% |
| Indonesia | 1766 | 0.3% |
| Malaysia | 1497 | 0.3% |
| Hungary | 1493 | 0.3% |
| Austria | 1465 | 0.3% |
| Portugal | 1360 | 0.3% |
| Chile | 1263 | 0.2% |
| Serbia and Montenegro | 1254 | 0.2% |
| China | 1252 | 0.2% |
| Singapore | 1160 | 0.2% |
| Ukraine | 1132 | 0.2% |
| Israel | 1126 | 0.2% |
| Thailand | 964 | 0.2% |
| Slovakia | 914 | 0.2% |
| Slovenia | 883 | 0.2% |
| Peru | 856 | 0.2% |
| Hong Kong | 754 | 0.1% |
| Croatia | 661 | 0.1% |
| United Arab Emirates | 577 | 0.1% |
| Uruguay | 535 | 0.1% |
| Taiwan | 518 | 0.1% |
| Bulgaria | 457 | 0.1% |
| Mozambique | 445 | 0.1% |
| Pakistan | 439 | 0.1% |
| Costa Rica | 412 | 0.1% |
| Bosnia and Herzegovina | 360 | 0.1% |
| Lithuania | 360 | 0.1% |
| Estonia | 341 | 0.1% |
| Colombia | 337 | 0.1% |
| Iceland | 332 | 0.1% |
| Saudi Arabia | 311 | 0.1% |
| Sri Lanka | 309 | 0.1% |
| Egypt | 285 | 0.1% |
| Vietnam | 265 | 0.1% |
| Kuwait | 262 | 0.1% |
| Mauritius | 251 | 0.0% |
| Venezuela | 209 | 0.0% |
| Georgia | 200 | 0.0% |
| Latvia | 197 | 0.0% |
| Kenya | 190 | 0.0% |
| Nigeria | 190 | 0.0% |
| Puerto Rico | 185 | 0.0% |
| Macedonia [FYROM] | 183 | 0.0% |
| Kazakhstan | 180 | 0.0% |
| Paraguay | 180 | 0.0% |
| Cyprus | 153 | 0.0% |
| Guatemala | 150 | 0.0% |
| Luxembourg | 148 | 0.0% |
| Trinidad and Tobago | 144 | 0.0% |
| Cambodia | 134 | 0.0% |
| Lebanon | 121 | 0.0% |
| Tunisia | 121 | 0.0% |
| Jamaica | 114 | 0.0% |
| Qatar | 113 | 0.0% |
| Barbados | 110 | 0.0% |
| Angola | 103 | 0.0% |
| Algeria | 102 | 0.0% |
| Belarus | 95 | 0.0% |
| Morocco | 94 | 0.0% |
| Dominican Republic | 76 | 0.0% |
| Panama | 76 | 0.0% |
| Ecuador | 67 | 0.0% |
| Azerbaijan | 63 | 0.0% |
| Bangladesh | 61 | 0.0% |
| Oman | 59 | 0.0% |
| Bolivia | 58 | 0.0% |
| El Salvador | 58 | 0.0% |
| Syria | 57 | 0.0% |
| Cayman Islands | 56 | 0.0% |
| Armenia | 53 | 0.0% |
| Mongolia | 53 | 0.0% |
| Namibia | 53 | 0.0% |
| Albania | 52 | 0.0% |
| Iraq | 51 | 0.0% |
| Aruba | 49 | 0.0% |
| Guyana | 45 | 0.0% |
| Jordan | 42 | 0.0% |
| Saint Vincent and the Grenadines | 40 | 0.0% |
| Bahrain | 38 | 0.0% |
| Sudan | 38 | 0.0% |
| Ghana | 36 | 0.0% |
| Uganda | 35 | 0.0% |
| Palestinian Territories | 34 | 0.0% |
| Bahamas | 32 | 0.0% |
| Guam | 32 | 0.0% |
| Brunei | 30 | 0.0% |
| Laos | 30 | 0.0% |
| Nicaragua | 30 | 0.0% |
| Uzbekistan | 28 | 0.0% |
| Netherlands Antilles | 27 | 0.0% |
| Reunion | 27 | 0.0% |
| Botswana | 26 | 0.0% |
| U.S. Virgin Islands | 26 | 0.0% |
| Liechtenstein | 25 | 0.0% |
| Honduras | 24 | 0.0% |
| Myanmar [Burma] | 24 | 0.0% |
| Zimbabwe | 24 | 0.0% |
| Maldives | 23 | 0.0% |
| Madagascar | 22 | 0.0% |
| Belize | 20 | 0.0% |
| Bhutan | 20 | 0.0% |
| Fiji | 20 | 0.0% |
| Senegal | 20 | 0.0% |
| Bermuda | 19 | 0.0% |
| Macau | 18 | 0.0% |
| Samoa | 18 | 0.0% |
| Nepal | 17 | 0.0% |
| Timor-Leste | 17 | 0.0% |
| Tanzania | 16 | 0.0% |
| Monaco | 15 | 0.0% |
| Suriname | 15 | 0.0% |
| Ethiopia | 13 | 0.0% |
| Libya | 13 | 0.0% |
| Moldova | 13 | 0.0% |
| Guadeloupe | 12 | 0.0% |
| Iran | 12 | 0.0% |
| Dominica | 11 | 0.0% |
| Papua New Guinea | 11 | 0.0% |
| Zambia | 10 | 0.0% |
| British Virgin Islands | 9 | 0.0% |
| Cuba | 9 | 0.0% |
| Vanuatu | 9 | 0.0% |
| Gibraltar | 8 | 0.0% |
| Rwanda | 7 | 0.0% |
| Cameroon | 6 | 0.0% |
| Djibouti | 6 | 0.0% |
| Yemen | 6 | 0.0% |
| Gambia | 5 | 0.0% |
| Cote d'Ivoire | 4 | 0.0% |
| Haiti | 4 | 0.0% |
| Lesotho | 4 | 0.0% |
| Guinea-Bissau | 3 | 0.0% |
| Afghanistan | 2 | 0.0% |
| Eritrea | 2 | 0.0% |
| French Guiana | 2 | 0.0% |
| Greenland | 2 | 0.0% |
| Kiribati | 2 | 0.0% |
| Kyrgyzstan | 2 | 0.0% |
| Malawi | 2 | 0.0% |
| New Caledonia | 2 | 0.0% |
| Northern Mariana Islands | 2 | 0.0% |
| Saint Lucia | 2 | 0.0% |
| Turkmenistan | 2 | 0.0% |
| Turks and Caicos Islands | 2 | 0.0% |
| Anguilla | 1 | 0.0% |
| Antigua and Barbuda | 1 | 0.0% |
| Faroe Islands | 1 | 0.0% |
| Guinea | 1 | 0.0% |
| Liberia | 1 | 0.0% |
| Norfolk Island | 1 | 0.0% |
| Seychelles | 1 | 0.0% |
| Solomon Islands | 1 | 0.0% |
| Togo | 1 | 0.0% |
| Tonga | 1 | 0.0% |