 |
| Music |
| Songs |
| Song Years |
| Song Artists |
| Song Titles |
| Song Charts |
| Albums |
| Album Years |
| Album Artists |
| Album Charts |
| Site Index |
Artist Profiles |
|
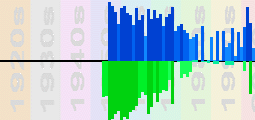
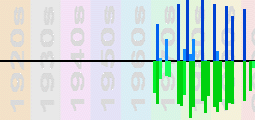
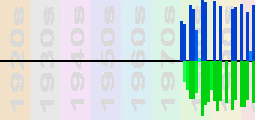
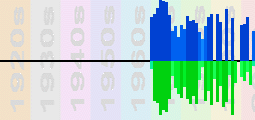
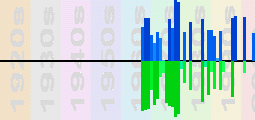
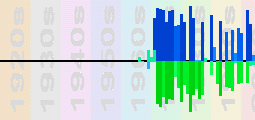
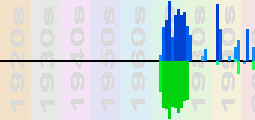
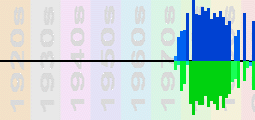
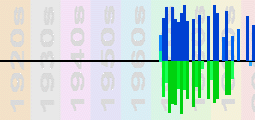
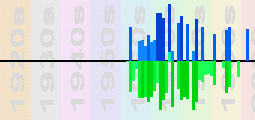
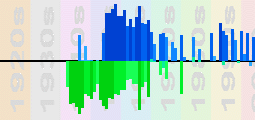
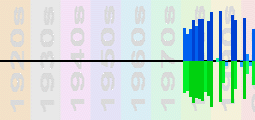
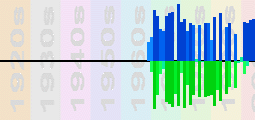
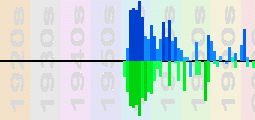
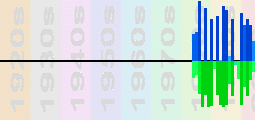
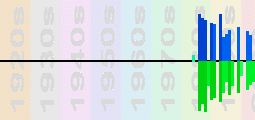
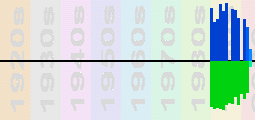
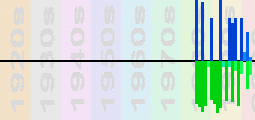
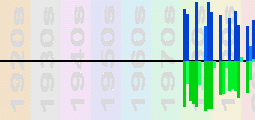
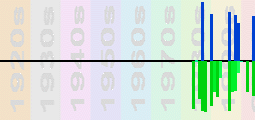
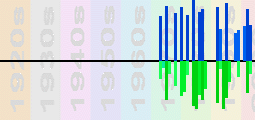
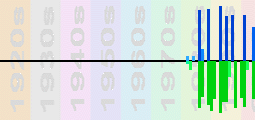
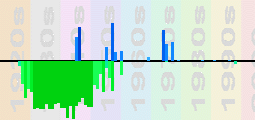
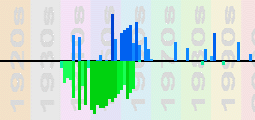
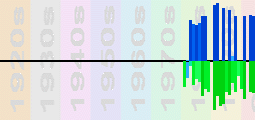
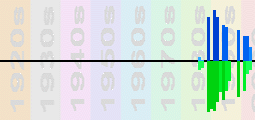
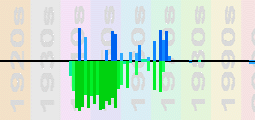
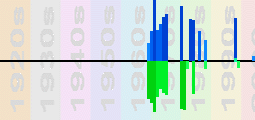
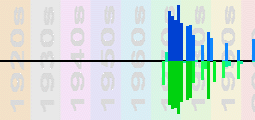
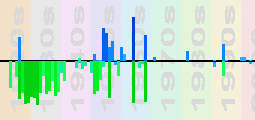
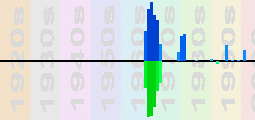
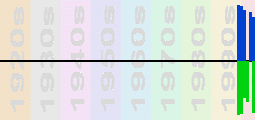
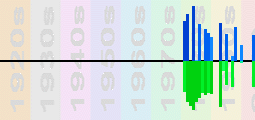
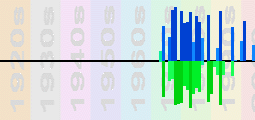
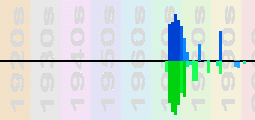
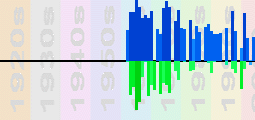
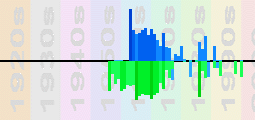
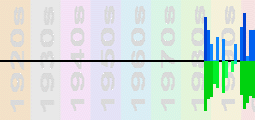
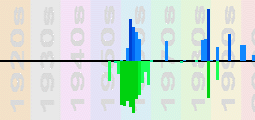
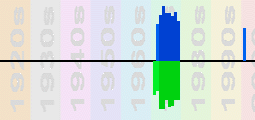
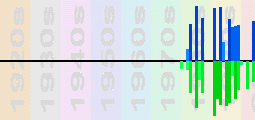
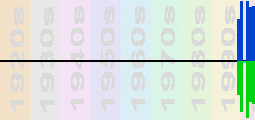
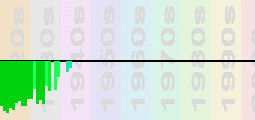
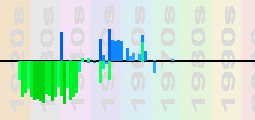
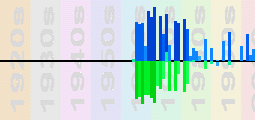
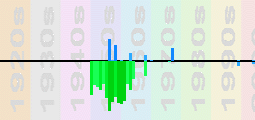
Each artist page includes a "profile" picture that provides a summary of success in the charts. The profiles show success by year for album and song charts, the albums are shown in blue above the line and the songs in green below the line. In the example above you can see that this act first had hits in the mid fifties, the darker green shows that he was one of the most successful singles acts of those years. His hits dried up in the late seventies, with just a few hit albums in the ninties and then a sudden album led success in the new millenium.
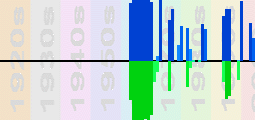
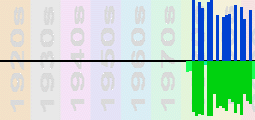
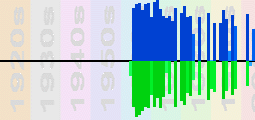
For those interested in the details the height of each bar is related to the logorithm of the artist's total score for the year. In other words if a score of 1.0 is one unit high then 10.0 would be two units and 100.0 three, so high bars represent a really significant success. The colour of the bar relates to the artist's position in the year, the top 5% of artists in a given year get the darkest colour, the other breaks are at 15% and 50%. Any year where there are few charts will therefore have smaller bars in the darker colours. Album charts only start in 1950 so artists with success before then will have little above the line.
Here are the artist profiles for the 50 artists with the most success in the 143 song charts.

Previous Comments (newest first)
26 Apr 2011
donload the orginial songs by the orginal artists - where would you +find them+
eg.the top 100/40 1945,1946,...to 1990 +each year. also the top lp's each year. please answer asap thanks.
scott
This is a site listing music charts, we don't have any music files to download here. You can use our lists to identify the songs on iTunes or Amazon.