 |
| Music |
| Songs |
| Song Years |
| Song Artists |
| Song Titles |
| Song Charts |
| Albums |
| Album Years |
| Album Artists |
| Album Charts |
| Site Index |
How is the site is generated? |
|
Each of the 238 source charts is held separately, every chart always has entries for "artist" and "title" usually they also have entries for "position" and "date" and may also contain all sorts of extra information such as "duration", "written by", "web page" or "film".
The 529,467 items in these charts are consolidated, to provide a complete set of attributes for each of the 244,171 items (154,916 songs and 89,255 albums). The most difficult aspect of this task is matching names, they are often misspelt in the source charts, punctuation is usually inconsistent and the list of "featured" artists is always in a different order. Programming a system to recognise that "Uncle Albert" by "Paul McCartney" and "Admiral Halsey" by "Wings" are actually the same song is not trivial.
In general the approach that has been taken is to consolidate entries if they appear similar, having too many false connections is usually better than missing out on them. For this reason there are quite a few places where entries have been changed to bring things together, for example all of Prince's songs are listed under the name Prince rather than splitting them into Prince & the New Power Generation, Prince (symbol), Love Symbol, The Artist Formerly Known As... and so on.
Assigning a Score
When we originally started gathering chart information we didn't want to allocate an arbitrary score to each song, our goal was to provide a list of the achievements of each record without imposing any kind of artificial order. We quickly discovered, however, that a rough indication of the importance of each item was an essential guide to presentation.
So how can each entry be compared? The most obvious option is to work out a scoring mechanism and list songs from the highest score to the lowest. That is the obvious way to do it, but is it the best way? An alternative way to order two songs might be to measure how many charts rate one higher than the other and list the songs that win the most comparisions. There might be stats gurus who can work out which of two scoring algorithms deliver the most reliable results, but we don't know any. So we created a computer model of different ways to generate random charts and measured how well different approaches did. So far the best overall approach we have found is to assign a score for each chart and add these up to create an overall measure of success.
Given that we are assigning a "score" for each item, how should this be calculated. We considered this question in three parts:
- What value should each chart entry have
- What relative weighting should each chart get
- How should the calculated values be combined to create an overall score
Score for each appearance
One obvious way to allocate a score would be to just count the number of chart appearances, but we felt that an entry at the number one slot is more notable that one lower down the chart. An alternative that we have seen used is to give 1 point for a 99th position, 2 for 98th and so on up to 98 points for a 2nd and 99 for a number one. Again that doesn't feel right, surely a number one record is significantly more notable that a number 2, and what about charts with 200 entries? We need a function, f(p) where f(p) is always bigger than f(p+1) and where the step between f(p-1) and f(p) is always bigger than f(p) to f(p+1).
An interesting question is what is the basis of this score, what are we trying to estimate? Well, if the score reflects a rough estimate of the "notability" of the song, a combination of sales, airplay and mindspace then we should adopt an approach that models, for example, sales figures.
There are two different curves that have been suggested as being good descriptions of sales, one is an "exponential decay" that suggests the Nth best selling item sells Y**N times as many as the top one, where Y is a number between 0 and 1 and ** is the "power of" operator. The other estimate is Zipf's law, which says that the 2nd best seller sells half, the 3rd one third and so on. This suggests two different ways to score a chart entry:
- X + Y**position
- X + Y/position
In fact, for reasonable selections of the parameters, both approaches deliver roughly similar results, but the parameters X and Y values do emphasise different records.
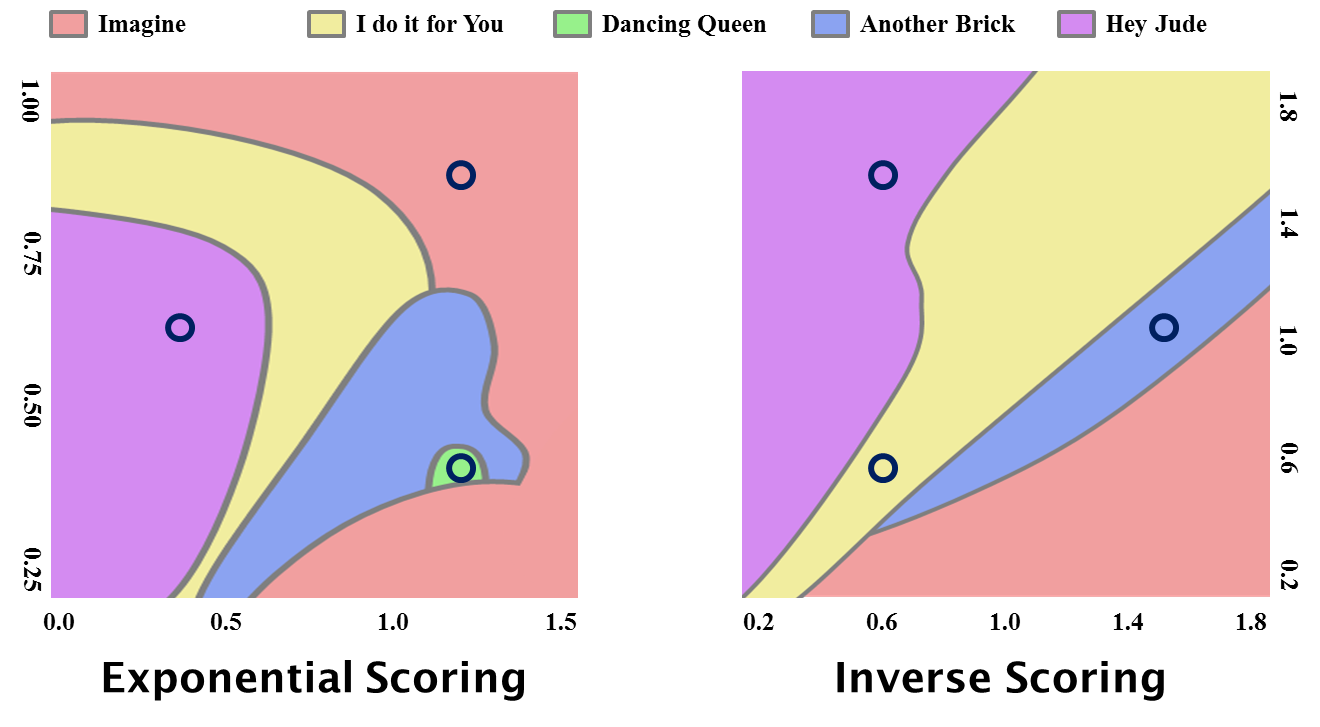
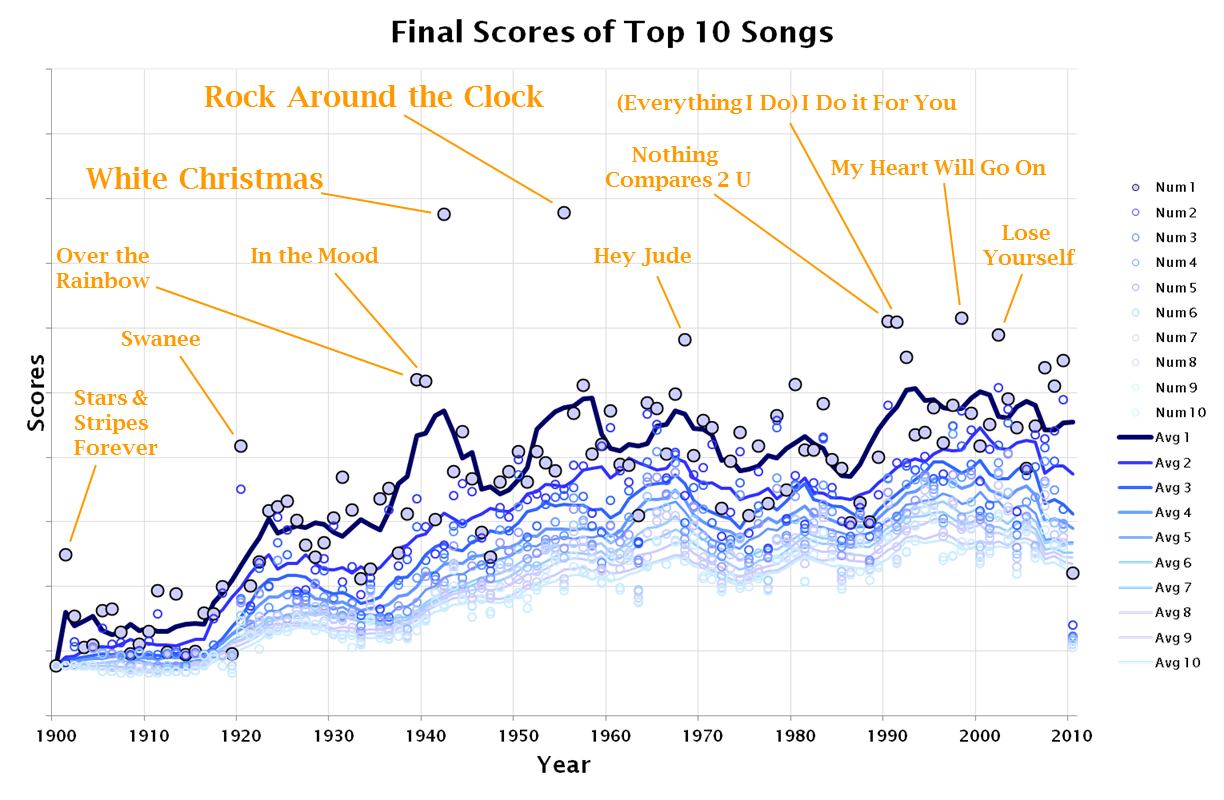
Here is a "phase diagram" (based on the 1.1 version of the data) which shows which song comes out top as different values of X and Y are selected. The black circles indicate six combinations of parameters that could each be considered reasonable. Here is a comparison of the top 10s that result for these values.
As you can see the results are roughly similar, however their differences show just how arbitrary any scoring mechanism is. So if we select the simpler algorithm, the one based on Zipf's Law, and middling parameters, we have:
- score = 1 + 1/position
This means that 3 number one hits are equivalent to 4 at number two, 5 at number five and roughly equivalent to 6 at number 100. That feels like it is fair, it is fast to calculate and gives results that are as good as any other scoring approach.
Weighing each chart
When we originally calculated the total scores from these charts we felt that the simplest way to combine charts from different locations and eras was to just add the scores together. After all "The Wisdom of Crowds" shows that having a larger number of contributing charts provides a more reliable result (provided that every effort is made to remove systematic bias). We had tried weighing charts based on "notability", but that just leads to debates about which sources to trust and market share. In addition it overemphasises regions with few entries (for example Japan in the 1990s), so before version 2.0 of the data all charts were given an equal weight of 1.
So an equal weighting was used here for a number of years, however some users pointed out a number of odd features. For example the influence of European markets in the 1990s was overwhealming the US entries from the same era. At the same time that each individual European country was getting its own chart (or at least making the charts available) the USA was focusing all chart activity on the single Neilson/ Billboard charts, so magazines like Cashbox and radio stations stopped publishing their own.
So the scores need to be scaled somehow, but scaled in a rather special way. If the scores are scaled to end up distributing "points" in some way then periods that have very few entries will assign all their points to those few songs, so the chart would be dominated by songs that were a success in places with few charts. So we calculate a factor that takes into account the size of the music market for a region and the number of existing charts (details below).
Combining Scores
There are all sorts of ways that we could combine the scores of from different charts. The simplest approach is just to add them up. This is what we do.
Special Cases
The preceding approach works well for charts that have a position attribute. But what do we do for those that don't? What about:
- Annual Awards: Such as the Grammy. Just assign each recipient a virtual number one position
- Certifications: Gold, Platinum etc. Just translate each award level (Multi-Platinum, Platinum, Multi-Gold, Gold, Silver etc) into a score that is similar to the one it would have got in an ordered list of the awards.
- Claimed Sales: Just order the list and use the position
Artists, Years, Decades and hits in Europe
In order to combine scores to rate, for example, artists, we take the obvious approach of summing the items they produced. This is the algorithm used for all the "normal" web pages.
If we are doing a special calculation (that is for one of the FAQ pages) we often adjust the scores to take into account the large number of recent charts. So, for example, when working out the most successful song or greatest song act, we employ an adjustment to normalise the scores. This is normally calculated by averaging the score of entries in the fifth to tenth positions and using the result to rescale the scores. Some experimentation has shown that this produces reasonable results.
Song Years
Working out which year to assign an entry to is also surprisingly hard. The year of each song is deduced directly from the chart entries, rather than relying on some kind of unreliable external source. The year is extracted from the date in all the song's chart entries and the song's year is set to the median of these values. This usually generates a reasonable estimate of the year.
Putting it all together
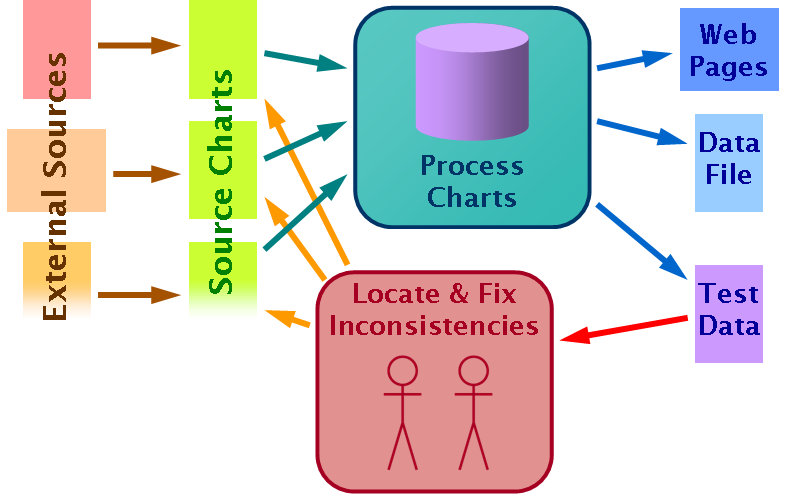
Once the individual song scores have been calculated they are processed to generate the various web pages and the links between them. These are all static pages to reduce both the load on the underpowered web server and the security risks.
As the diagram shows the process also generates some summary statistics and other test data. This is used both to spot when new data has introduced issues and to simplify the task of identifying entries that need to be reviewed.
Scaling Charts
The version 1 data provided a reasonable listing of success for any one year, however a number of users pointed out that there were some strange features. For example during the 1990s the European charts were more influential than the US ones, despite those markets generating a smaller revenue. We decided to review the chart scaling factors, could we just choose a factor to make all periods deliver the same number of "points"? The scaling has to be more complex than that, the first issue is that the reason for having so few chart entries for the period from 1900 to 1920 is that there is less modern interest in the music of that era than in later years. Judging by the small size of the "music business" at the time, this disinterest reflects contemporary views. Scaling these types of years by a single factor makes it too likely that a single entry will, purely by chance, have a large enough lead over its competitors to end up with a really high score.
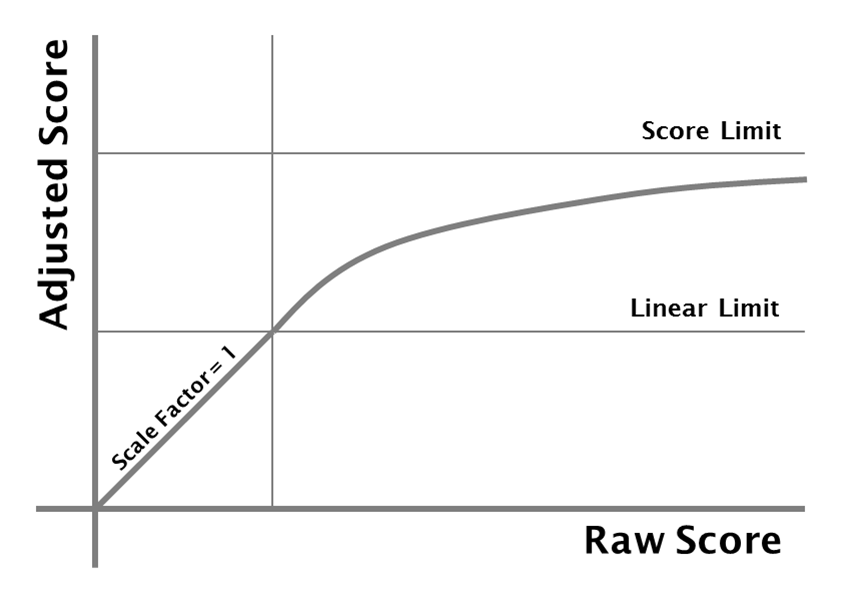
So let's say the scaling factor has a value of 1, up to the point where a year has more than a certain number of entries, and then the factor decreases so that a year with a really large number of entries approaches some limiting score. Tweaking the score limit and the linear limit allows us to test different approaches. Setting the score limit to twice the linear limit seems to deliver results that have the appropriate profiles.
So for any periods where there are few entries the scores have to be scaled by a factor of 1, otherwise songs that are a big success in a small market would dominate the results. But if a region has a large number of entries then these should be scaled by a factor less than 1, to ensure the influence of that region is in line with the size of the music market. So the weighing factor has to depend on the number of entries in a region for a given period. The scaling factor cannot be set by the highest scoring song in a region, that would just make every year's result flat, while there should be a chance for a big hit to have a bigger influence. The score is summed for the 20th to 100th highest scoring songs of each year in each region and this factor defines the scaling.
The charts we have are heavily biased towards the USA for the early decades and towards Europe for the later periods. One option would be to consolidate the whole world together, but that causes the 1990s and 2000s to reflect Europe's tastes rather than the world's. Another option is to consolidate entries by country and then scale the results by the size of the music market, but that doesn't work because there are too many locations that just have no data available.
So we have to pick an approach that avoids both being too broad and being too narrow. The approach we selected was to split the world into four regions, the USA (about 35%), other English speaking countries (about 20%), the rest of Europe (about 25%) and the rest of the world (about 20%). By selecting these regions and using the scaling approach we can balance out the scarcity of evidence against the regions that have so many more.
This approach does give rise to some unexpected results. When there is hardly any evidence, as for example the "rest of the world" during the 1970s, the values can be highly scaled, so a single number 1 entry in a Japanese chart causes a song to be listed in the top 100 for that year. We have adjusted the factors to ensure that this, to us clearly undesirable, result does not occur. Some entries in 1940 year charts are perhaps overly influenced by the Australian charts, but its not so clear to us that this is wrong and we've not found a simple way to overcome that manifestation.
The final process is a fairly convoluted approach that has been tuned to deliver results that seem reasonable in a wide range of circumstances. We have, of course, deliberately avoided allowing any post-calculation "tweaks" that promote or penalise particular songs, acts, genres or periods. The first release using this calculation was released as version 2.0 in October 2011. Within days of publication user feedback had pointed out some minor issues and this caused us to add some of the refinements outlined above before delivering version 2.1 in November 2011. Since November 2011 we have continued to look for further unwanted results this has caused us to create version 2.2 (which reduced the impact of the uncertain years before 1930, (in Jan 2014) version 2.3 that readjusted the song year weights to reflect new charts added in the last year and (in Nov 2015) version 2.4 that again readjusted the song year weights to reflect new charts added since then.
The 2.0 results seem to provide reasonable values from 1940 to 2009, in other words for all the years where we have a reasonable level of source charts.
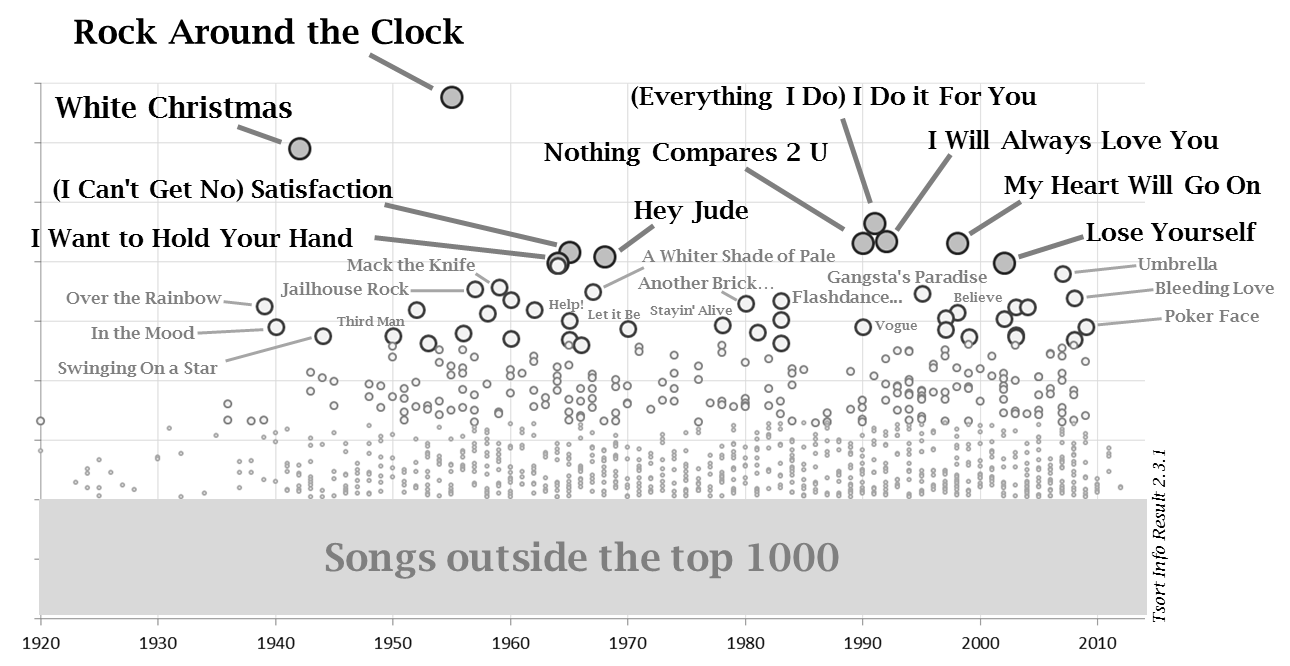
As more chart data has been added the factors (and algortithms) have been tweaked to remove unwanted effects. The results from the Jan 2014 adjustment (creating version 2.3 of the data) are shown above. The overall end positions are broadly compatible with the base 2.0 results above.
The 2.5 version of the algorithm uses a factor to adjust scores by year and region. This was originally based on the calculation shown above, but now when the results are calculated the items in positions 1000 to 2000 are examined and any years that have too much contribution from one of the four regions have their factors adjusted. This means that as new charts are added the factors can be adjusted to ensure the results are consistent. Focusing on the scores for the lower positions ensures that no systematic biases are introduced, but it does mean that the factors have to be stored rather than calculated. Another feature that 2.5 introduced was to emphasise items that were hits in more than one "region" this is done by increasing the factors for items by 1.1**(num regions - 1), so a song that is a hit in just one region gets a 1.0 times the factor, two regions get 1.1 times, three regions 1.21 times and all four regions 1.331 times.
Recent Years
The approach described above works very well for years when plenty of charts are available, but it does not produce such good results for recent years. This is because it often takes ten years for retrospective charts to show up. Also for recent years there are some fairly reliable charts for each country. For recent years it would be better to create a chart for every day that combines input from the most reliable sources. So that's what we did, we created the site //chart2000.com/ which lists album and song charts for every day, month, year and decade (showing the peaks that was achieved in each location).
We decided that the annual charts (up to last year) that are listed on the that website were better than the charts on tsort.info (and more recent). So we've added that data in, and for recent years it dominates our listing. This started with data version 2.7.001
Different Approach?
As with all the calculations described on the site you can decide to try a different approach, we have provided a range of CSV data files you can use to explore the data (and its processing):
- csv/top5000songs-2-9-0001.csv: The top 5000 songs and scores for each region
- csv/top3000albums-2-9-0001.csv: The top 3000 albums and scores for each region
- csv/yearfactor-2-9-0001.csv: The factors for each year for each region for songs and albums
That sould provide all the data you would need to try you own calculations, try working out who were the biggest acts of each decade, which songs had most regional success, or whatever you want to investigate. If your work illustrates something interesting we would like to hear about it.
Previous Comments (newest first)
10 Jul 2021
Question about titles of sons
Hi, I was wondering if this site, or if you know any site, that has just asimple list of songs of each year, preferably internationally. I just want A to Z and all I really need is song title and artist. If i could come upon this in any way, it would be very helpful. Thank you.
This site lists the top 100 international songs. A list of all songs from each year would be very long.
27 May 2020
Highest Climber
How do you find highest climber to the top 40 and top 75. Because Top of thePops say chart entry threw out the 1980s and I find it difficult. Can you help please. Many Thanks
That question makes no sense to us.
15 Aug 2019
Stager lee re recorded what year
There was a re recording of Stager lee by Lloyd Price what year was the rerecording? Thank you.+
27 Aug 2018
Sale models
I can tell why 1990s charts are morely like 'Europe charts'. Cause 1990s many new chart sources are from Europe. Have you tried to remove the year chart sources in Decade charts, so as the decade chart sources from all-time charts? Another thing, the number 1 has 1000 copies sold, and number 2 500,number 3 250,etc. etc. etc. I'm not doubting but that could not be right. For example, 'Thriller' has a much more American sales than 'Rock on'(from US charts) the sales could be extremely different even they were both number 1.The sale models are totally different from FAQ.
That is already been taken account of in the way charts are adjusted.
8 Aug 2018
'There are two different curves that have been suggested as being good descriptions of sales' Those information are based on what?
See, for example, the Wikipedia article of Zipf's Law (and many other sources)
27 Jun 2018
What happened+
The importance of each charts should base on music market, it's true but notcompletely. +Actually some charts from, for instance, holland and Switzerland, are not so commercial before, that means the charts of them may reflect what people really like to listen .Will you do a research about the rules of every chart? That will be necessary for your result. Then, weigh them again, you'll see
Based on what criteria? Its enough work to just gather the charts, if we tried your approach we'd never get anything done. However we would be interested to hear from you if you can do that work.
16 Jun 2018
How do you avoid this
One thing you need to have noticed:Do not use approximations when you calculate every song's score. For instance when a song's French chart's score is 2.46552837,when you take 2.466,so does the American score and British score,then the final score would be effected. Scores from some songs are very close ,then the song's ranking could also be changed. Here are more than 10000songs on this website,how do you avoid problems like this?
Just because the score is reported rounded does not mean that it is rounded when the charts are actually calculated, the rounding is only done on the CSV output to reduce file sizes and make them more regular. To be honest if the scores are so close that values down in the floating point fluff are affecting positions then the positions should be affected (and the positions don't mean much). Positions are only valuable if there is a clear difference between them (like there is at the top of the chart)
We don't see that as a problem. Often the lower ranked songs *are* hard to distinguish between.
30 Apr 2018
Some suggestions+
1:Some charts,like RYM charts has changed. 2:There ain't too many "Rest of the world chart before 2000.and music market in rest places was not prosperous before 2000.It shouldn't be 20% of the each song point.maybe you should find another way to calculate the song point before 2000, rules now truly, perhaps only believable after 2000.
30 Mar 2018
About Some Source Charts
Hi I really like this website.I'm collecting some 80s (1979-1989)songs recently.This web helps a lot.Great job.
My doubt is,I don't think year end charts like US BB is so reasonable.Like,George Michael's "Faith" was number 1 in 1988,but we all know some songs released in 1988 charted better than "Faith","Faith"was top 1 just because it released earlier than other songs.Year end charts only show how did these copies sold in this year. "Another brick in the wall" was released in 1979,so it will affect it's ranking in 1980. Also,I think how long did thesongs remain on Top 10 is also important.Some songs hit no.1 very fast but drop out so quick.Some songs got top 1 for 10 weeks,for luck (We didn't have too many songs to listen at that time).
You are right, items that span across boundaries tend to be underrated. There are two different ways to summarise time sequences, one is to accurately assign "scores" to the appropriate time periods and then list success ONLY for those periods. This is the approach taken on the companion site (https://chart2000.com/). But, that doesn't work if the underlying data doesn't make the time peiods clear. The data shown on this site doesn't have enough granularity for this to work (at least not until after about 1980) so, on this site we have to impose arbitrary boundaries and work within them.
We could attempt to assign scores to time periods, but that would take a lot more work (and its hard enough to just collect the data we have).
Your comments are exactly right, but unfortunately we don't have enough of the data for that approach to work in the 1980s (we do starting in 2000 and that's what the chart2000 site does)
12 Dec 2016
Shakin stevens+
Shakin stevens
17 Aug 2016
Full Spreadsheet
Can you bring back the full spreadsheet that lists all the songs and albums on this site?
The full spreadsheet never went away. It can be accessed through the versions page, or various other links. We suspect that you have a stale link to a version that is no longer available, remember that the CSV file name includes the data version number, so at the time of writing this the file is called "tsort-chart-2-6-0001.csv" but shortly the most recent version will be "tsort-chart-2-6-0002.csv" (and so on).
The version number is crucial to understanding what the data is telling you, so we won't ever create a file called (for example) "tsort-chart.csv". The text at the foot of each page tells you the version number (and links to the version page)
1 Mar 2016
I Want Candy+
I find it extremely difficult to understand how this song, which has appearedin countless movies, been covered several times and remains an 80s staple is no where to be found amongst your chart Dara. Am I missing something? I know it wasn't a huge seller or charter at the time but like many songs its popularity has grown with age. Surely it should appear someplace on your site.
Did you try the search box? It lists at least one version.
You are thinking of the Bow Wow Wow song from 1982 which reached number 9 in the UK and number 62 in the US. As you say never a huge seller or hit (which is why it is not listed).
15 Dec 2015
What Happened? Brother Can You Spare A Dime
I noticed that your Top 1000 Song Title List & Song Artist List have changeddramatically over the last few weeks e.g. this song was #326 in November and is now completely out of the Top 1000! There are dozens more examples like this. Was curious what new data or new formulas you are now using?
You will also have noticed that the major version number changed (2.5 to 2.6). The basic data has not changed (much), its the algorithm we use that is new.
The first thing to say is that the "Overall Top 1000 Songs" list depends strongly on how much you emphasise one year over another. If we counted up all the entries in charts then all the top songs would come from 1995-2005 (where we have most chart data). So we've applied some clever maths to overcome that bias.
The yearly charts are much more accurate because they compare songs from the same era and therefore from consistent sets of charts. We'd be relatively confident that Bing Crosby's "Brother, can you spare a dime?" was the second most successful song of 1932. Whether it was the 326th,, 1012th or 1696th song or of all time is much harder to judge.
The various things we do to overcome these issues are described in the FAQ "How is the site is generated?". The latest version change came because we found the "year adjustment factors" were slipping out of sync with the source data available (as we added more charts). So we have instituted a new scheme where we can validate the results (by looking at the songs that end up in positions 1000-2000) and use those results to tweak the year factors. This has the advantage that the factors better match the data but the disadvantage that we have to keep changing them.
In order that our more observant readers (such as yourself) can keep track and ensure we don't add an new unconscious biases we have made the year factors we use and the scores of the top 3000 songs (and top 2000 albums) available as CSV files. The final section on the FAQ explains the details. Have a play, see if you can find anything interesting (tell us if you do).
15 Sep 2012
What am I doing wrong?
Sorry if i did not understand well, but it was said that there are a total of 186,626 items (132,898 songs and 53,728 albums), but inspecting the CSV file (tsort-chart-2-1-0028.csv) and I found only 67,115 entries. Also, it was said that the "US Billboard" has 37,093 entries (I found 21,449 entries) and that the "Brazil" chart has 9,264 entries (I found 4,438 entries in the CSV file).
What am I missing?
Great site, by the way.
The vast majority of the 132,898 songs were the sole hit (in a single country) of an obscure artist. For various reasons (because we think only the top hits are interesting, because we don't want to be accused of breaching copyright etc) we only list the highest achieving entries.
If you want all 37,093 entries of the Billboard chart (for example) we suggest you go to the original source and obtain them, where possible we've provided the links so you can do exactly that. We think that the unique value we provide is that we show success across the charts (individual charts might, for example, confuse "The Jonah Jones Quartet" with "Jonah Jones" to pick an example that a reader recently pointed out).
So what we mean is that all our calculations are based on the full 132,898 songs, but we "only" list the most interesting 49,526 of them. We have tried to balance between having a site that is comprehensive enough to be interesting but not so large as to be boring (and we have had some users complain that the site is too large).
28 Dec 2011
v2
There are a lot of major changes in the latest version of ths list. Some songs/artists have disappeared completely. Some obvious problems also. For example Boby Fuller four I Fought the Law disappeared while the lesser known Tennessee Waltz is still there (had a lower score in previous versions)
The Bobby Fuller Four song "I Fought the Law" was a hit in 1966, while they released the "Tennessee Waltz" in 1959. The Bobby Fuller Four version of the second song still has a much lower score than the first, however it is listed in the CSV file because it is in the top 1000 song titles. We don't see that as a "problem", it is exactly the anticipated behaviour and what someone investigating the song "Tennessee Waltz" would want.
There were a lot of changes, that was the whole point of the new algorithm. It addressed what we felt were some significant distortions, such as the emphasis on European charts from the 1980s & 1990s. We knew the results would be different, that was why the data version number went to 2.0 (from 1.10).
The results do still have some issues, and if anyone can suggest ways to make the results more consistent we would be very happy to hear them, but we feel that the 2.0 data is a significant improvement on the older set.
14 Dec 2011
Sales
Hi , a great effort on the charts.
What i really wanna know more of is that Faith No More's Angel Dust is a higher seller tha The Real Thing?? I actually think that this could be correct cuz Angel... had huge success in Europe and South America whereas TRT 's biggest numbers come from The U.S only (with UK and Australia and Brazil)..and You have Album Of The Year higher than King For A Day...is this even possible?
First the ording here is about "success" rather than sales numbers. Mainly because sales numbers vary from year to year (1 million units in 2010 was more success than 1 million units in 1990) but also because quoted sales numbers are always lies.
In the US "Angel Dust" and "The Real Thing" were pretty much as successful as each other, as they were in the other English speaking countries (the UK, Australia etc). The real difference came from Europe "Angel Dust" was a hit in Germany, Austria, Norway, Belgium, Switzerland, Holland and Sweden, while "The Real Thing" was only a hit in Sweden.
"Album Of The Year" was a number 1 hit in Australia which "King For A Day, Fool For A Lifetime" wasn't, that is the main contributor to its higher final position.
12 Nov 2011
reshuffle
i really like this site. may i ask how come recently a reshuffle in the top lists occured
The way we calculate the scores was changed quite radically last month. That is why the data version number went from 1.10 to 2.0
The reason for the change was that some users pointed out some anomolies in the way songs from the 1990s were ordered. Particularly music that that had success in the USA but didn't do well in Europe. We modified the scoring system to overcome some issues with having too many charts from smaller countries.
The first attempt introduced some other unwanted features so the algorithm has been further tuned. We hope that the overall result is a better.
If you see any results that look "odd" tell us about them.
31 Oct 2011
G. Campbell
Glen Campbell's song 30 is a collaboration with Bobbie Gentry. I think, that Top 40 hits like "Can You Fool" or "Oh, Happy Day" have to be "higher" than songs, that were not as successfull as them. And I also think, that his "Wichita Lineman" deserves to be one of Top 40 hits of 1968.
The Bullfrog listing clearly credits Glen Campbell alone with the song "Let it be me". However, checking this on a few sites does show that on this occasion the Bullfrog listing is wrong.
Thanks for the correction, the data has been fixed.
You also suggest that a song peaking at 38 in 1978 should be listed higher than one peaking at 94 in 1981. We agree that does, at first sight, seem wrong.
We could cop out and say that by the time we are listing songs that far down the list the order is fairly arbitrary, what the listing here is really saying is that the last 18 or so songs were all 'minor hits'. We also could point out that 451 songs made the Billboard top 100 in 1978, while in 1981 there were 408, in other words it was harder to have a hit in 1981.
But while both these are true they don't explain why we have this particular situation. One thing to notice is that the peak of 11 in the Australian charts is rated as less important than reaching number 81 in the US. This is, of course, fair, since the population of Australia (22 million) compared with the USA (309 million) means that the music market in Australia is about 6% of the size of that in the US.
The explanation for this strange situation is rooted in the same basic process. The calculation of "overall success" can take various aspects into account, some distort the top ranking songs and some the lower ranking ones. There are no simple approaches (that we've found so far anyway) which don't leave anomalies somewhere, when you push down the wrinkle in the carpet of values all that happens is another bump appears on the far side of the room. Our choice has been to focus on getting the highest rated items 'correctly ordered' and we have felt that if this results in some odd situations towards the end of each artist's lists that is a price worth paying. Most users are interested in the ording of the top songs, not the last few.
If you, or indeed anyone, can suggest an approach that does a better overall job we would be happy to adopt it. The spreadsheet on the versions page provides the data you need to try things out.
Finally you suggest that "Wichita Lineman" deserves to be one of Top 40 hits of 1968. The scores are really quite close, no doubt an alternative approach would place Glen Campbell higher, but on this site we pick the algortithm and apply it. No one gets to fiddle with the results (even the administrators). So "deserves" really doesn't come into it, every song gets the position its chart entries entitle it to.
Once again if you can suggest a fairer scoring system we'd be happy to hear from you.
13 Sep 2010
Song listed
I'm starting to use your list as a reference for my music collections as the listing are superb and comprehensive, Great job.
However, can you list more songs than no. 100? What are the 100 songs represents in terms of chart ranking? are they in the billboard top 40? Base on the 100s, if the song ranking not up to 40 and above, then it would not be listed, is that right?
Desi Arnaz.
Thanks for the kind words, you are clearly using these lists the way we intended to revisit music of the past and suggest songs that should be tried out.
We specificly selected to show only the top 100 songs for a number of reasons, not least of which was that we felt most readers would think any more would be excessive.
The rankings are in order of the songs chart positions in all the charts it shows up in. So while a Billboard top 40 slot might be a good start a song has to have been a hit in more than just that one chart to make it to our list.
For example the Frankie Laine song "Moonlight Gambler" reached number 3 in Billboard, and number 13 in the UK chart, however because it was not a hit elsewhere it ranks as the 131st song of 1956 (and hence is not in this listing)
In contrast Louis Armstrong's version of "Mack the Knife" was number 1 in Australia, number 8 in the UK, inducted into the Grammy Hall of Fame in 1997 and got many other chart entries. However it was never a hit in the Billboard chart. We rank this song as number 28 of 1956, much higher than Frankie Laine's song.
We use a scoring system that is described in detail in the "Site Generation" FAQ page. It has been honed over many years and tested in a wide variety of ways. While, of course, any scoring system will have its pitfalls we feel that this one is both simple enough to be transparent and yet yeilds results that are usually reasonable.
2 Dec 2009
Genesis biggest seller
Hi I read with a friend of mine on a website that Genesis highest selling album is not We Can't Dance it is actually Invisible Touch. It looks like to me that your numbers and maybe statistics are outdated. We Can't Dance sold 22,000,000 copies worldwide and went 4 times platinum in the U.S. and Invisible Touch went 6 times platinum in the U.S. and has sold 24,000,000 copies globally. I even read on the VH1 website that Invisible Touch is Genesis highest selling pop album to date.
Thanks Aaron Wake
First of all thank you for your input. Of course most of the lists on this site measure success in the charts round the world and not sales. So, for example, the 1983 album "Genesis" lists higher than "Invisible Touch" because it was a hit in more countries, but it is fairly certain that its sales were lower.
Claims of worldwide sales on web sites are generally not trustworthy, for example on Wikipedia look at the number of page modifications and the length of discussions on all pages that mention sales numbers. The issue is that there are no validated worldwide sales numbers so every group of fans use their own approach to estimate numbers.
We do have a page that lists our estimates of sales numbers. We use a combination of the certification levels from the US, UK, France and Germany (the four biggest markets). That page describes how we combine those numbers to estimate worldwide sales. It also explains why we don't trust even our own listing of sales numbers.
The two albums you mention are listed on that page. Your numbers for the US sales are correct, however you don't list the fact that "We Can't Dance" was also 5xPlatinum in the UK and 5xPlatinum in Germany, while "Invisible Touch" was 4xPlatinum in the UK and 1xPlatinum in Germany. "Invisible Touch" was more successful in the US, however the certifications and chart positions show that "We Can't Dance" was clearly a bigger hit in Europe.
Our estimate is that "We Can't Dance" sold 15-24 million worldwide and "Invisible Touch" sold 12-17 million.
We don't know where VH1 got these numbers from, however we have seen other occasions when VH1 has over emphasised acts that were successful in the US and ignored acts that were hits anywhere else in the world. This is one of the reasons why we don't use any of their charts in this site.
So, we believe that the balance of evidence suggests that "We Can't Dance" sold more, however the wide margin of error leaves the question open. We also have learnt that you should not trust any website that lists worldwide album sales numbers (even our own).