 |
| Music |
| Computing |
| Info Arch |
| Theory |
| Practice |
| Glossary |
| Index |
Diagram |
|

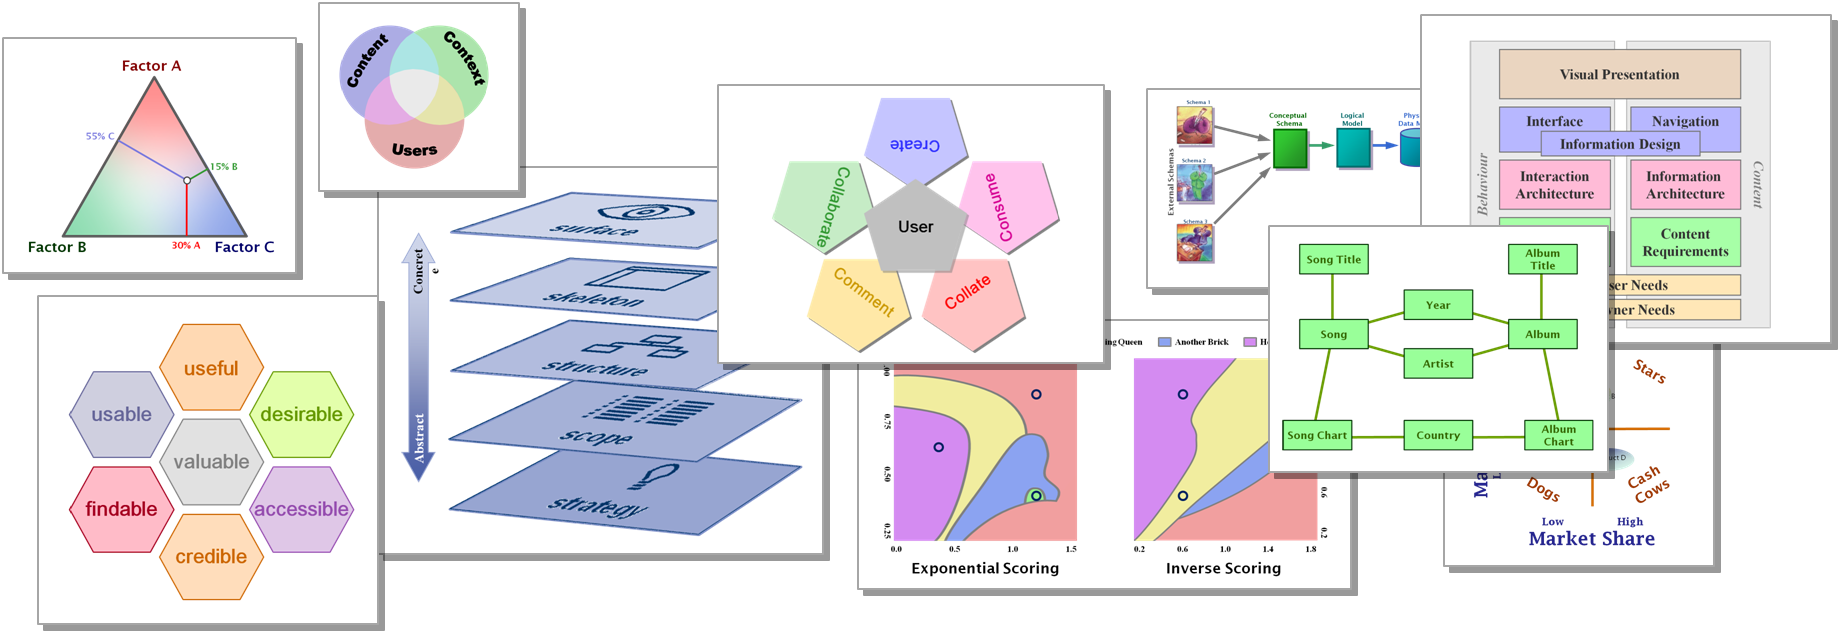
A picture showing information in a schematic form. The creation of a range of distinct pictures is a key skill for the Architect. Most people gain better understanding from pictures than they do from words, so most of the implementers will appreciate a finely honed graphic.
Studies have shown that presentations are much more effective when diagrams are used in preference to textual data (especially lists of bullet points).
Every Information Architect should be comfortable producing diagrams to illustrate the important elements of a system. Each diagram should be consciously targeted at a particular group of users or Subject Matter Experts. This in turn means that the conventions and expectations of the target audience must be taken into account when developing suitable pictures.
Links to this page
The following pages link to here: Aspect, Balance Triangle, Boxes & Arrows, Building Web Sites, Concept Map, Data Modeling Language, Enterprise Architecture, HSV Colour Space, IA Rendition, Information Architect, Karnaugh Map, Phase Diagram, RGB Colour Space, Schematic, Taxonomy, Unified Modeling Language, Uses for IA