 |
| Music |
| Computing |
| Info Arch |
| Theory |
| Practice |
| Glossary |
| Index |
Phase Diagram |
|
A depiction that shows all possible states of a system, each state corresponding to one unique point. The diagram usually shows the boundaries within which different "phases" will apply, for example the conditions of temperature and pressure that result in solid, liquid or gas forms of a substance.
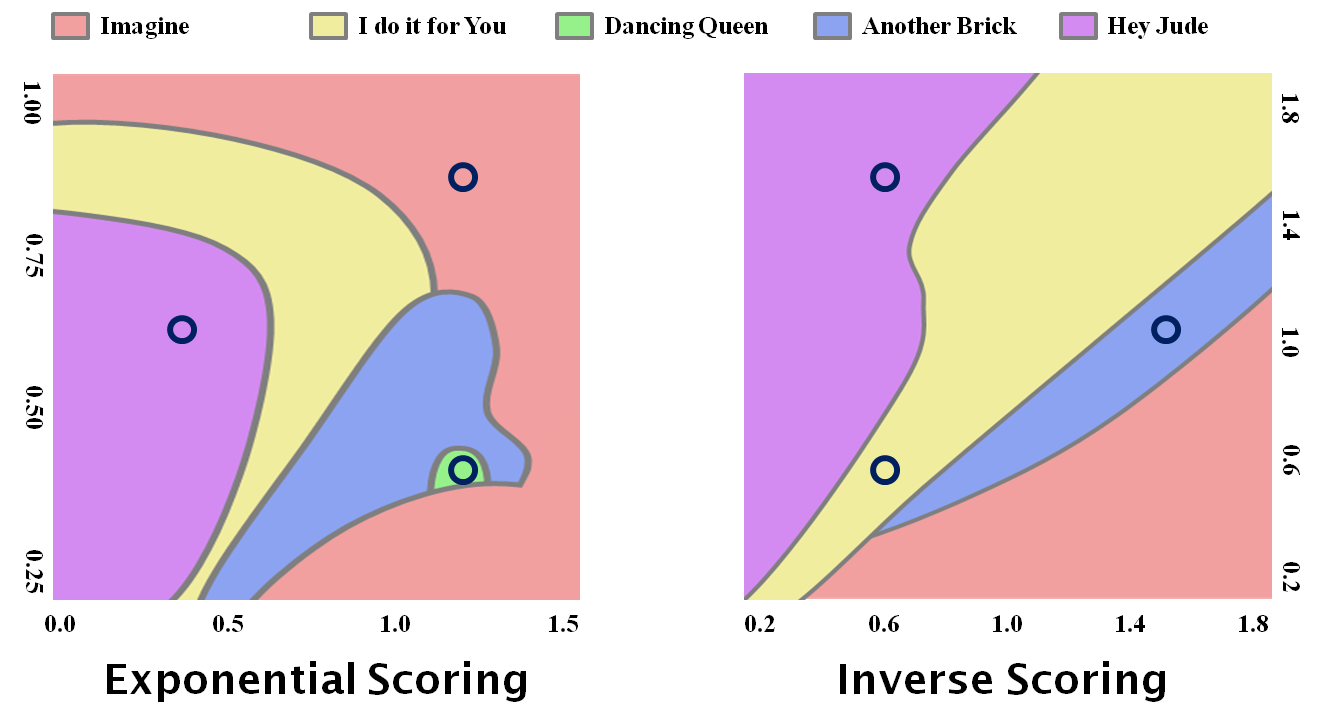
The above diagram shows a less standard form, in this case two different possible scoring algorithms are compared by showing which song comes top when different parameters are selected.
Links to this page
The following pages link to here: Balance Triangle