 |
| Music |
| Computing |
| Info Arch |
| Theory |
| Practice |
| Glossary |
| Index |
Probability Distribution |
|
The probability distribution describes the range of possible values that a random variable can attain and the probability that the value of the random variable is within any (measurable) subset of that range. A probability distribution identifies either the probability of each value of a random variable (when the variable is discrete), or the probability of the value falling within a particular interval (when the variable is continuous).
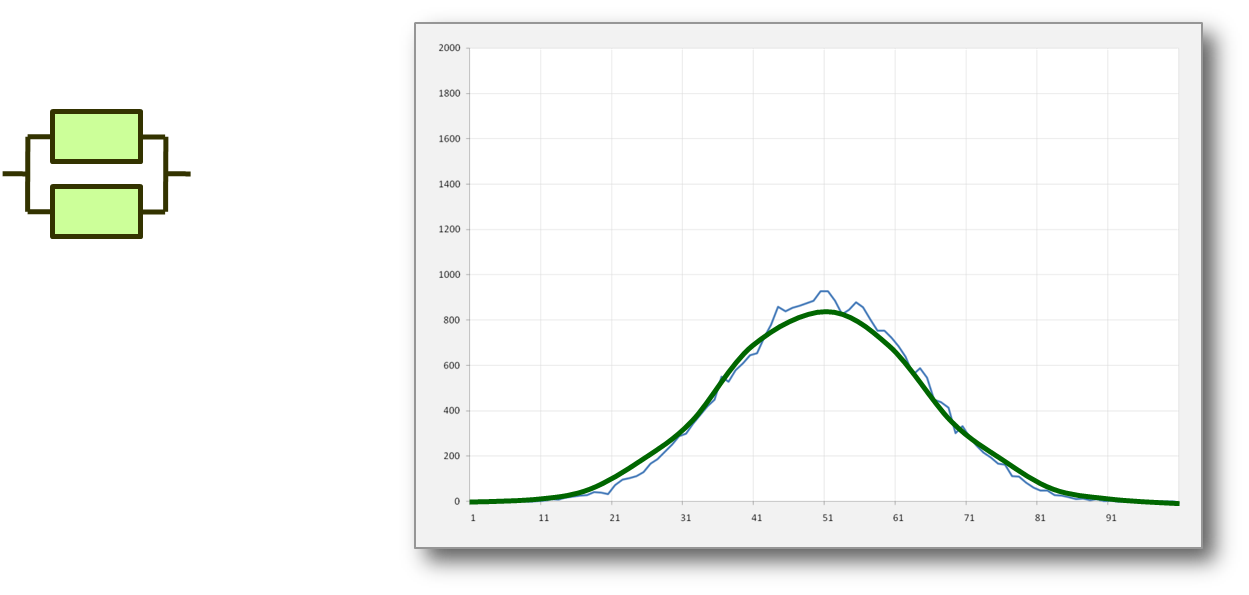
The majority of people don't have a good understanding of probability distributions. For example many people seem to believe that most measurements fall on a "Normal Distribution". This distribution is symmetrical and hence has the same mean and median values with a well defined drop off in probability away from this central value (the shape is similar to that of a bell which is why it is also known as the "Bell Curve").
This simplistic view leads to all sorts of specious reasoning (for an example see http://www.guardian.co.uk/technology/2010/jun/11/mobile-data-unlimited-end). While the Normal distribution is a reasonable picture for some phenomena it is clearly not appropriate in other situations.
The normal distribution is typically seen where multiple independent random factors cumulatively contribute to a result. For example errors in measurement or heights of a random population.
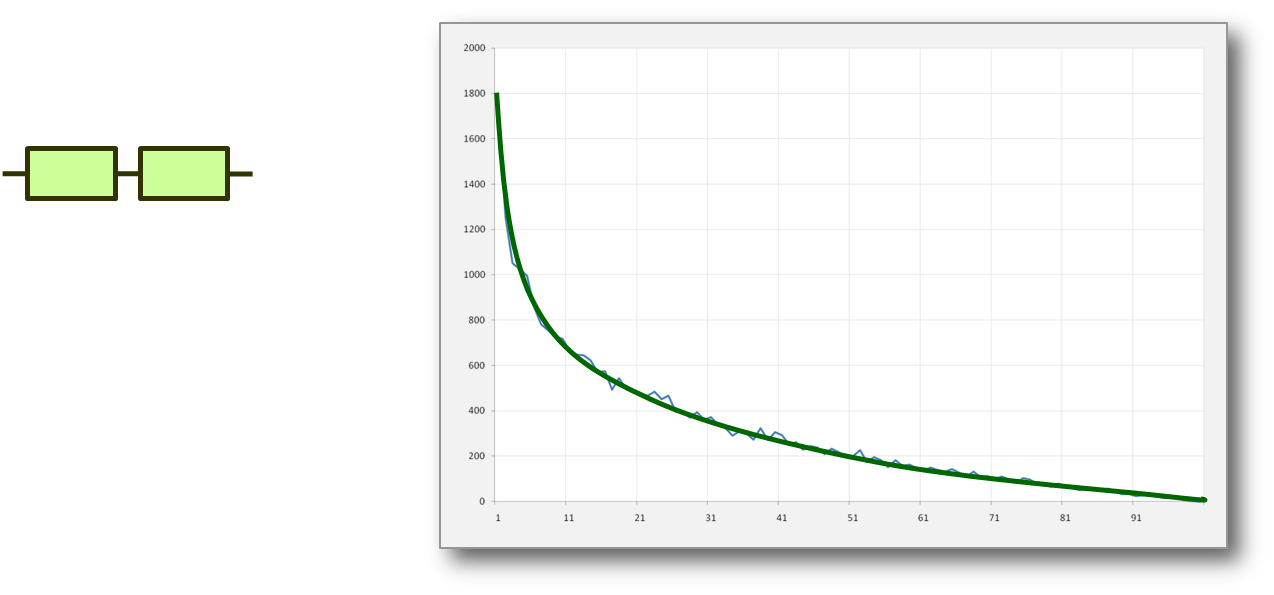
But what if there are a number of events that combine in other ways? For example what if we plot the number of coin tosses until we get a tail? In that case the distribution cannot possibly be symmetric.
In this case we get a distribution that has its largest peak at the smallest result and then drops off as the number gets larger. This type of geometric distribution is a reasonable description when we are looking at events which are rare.
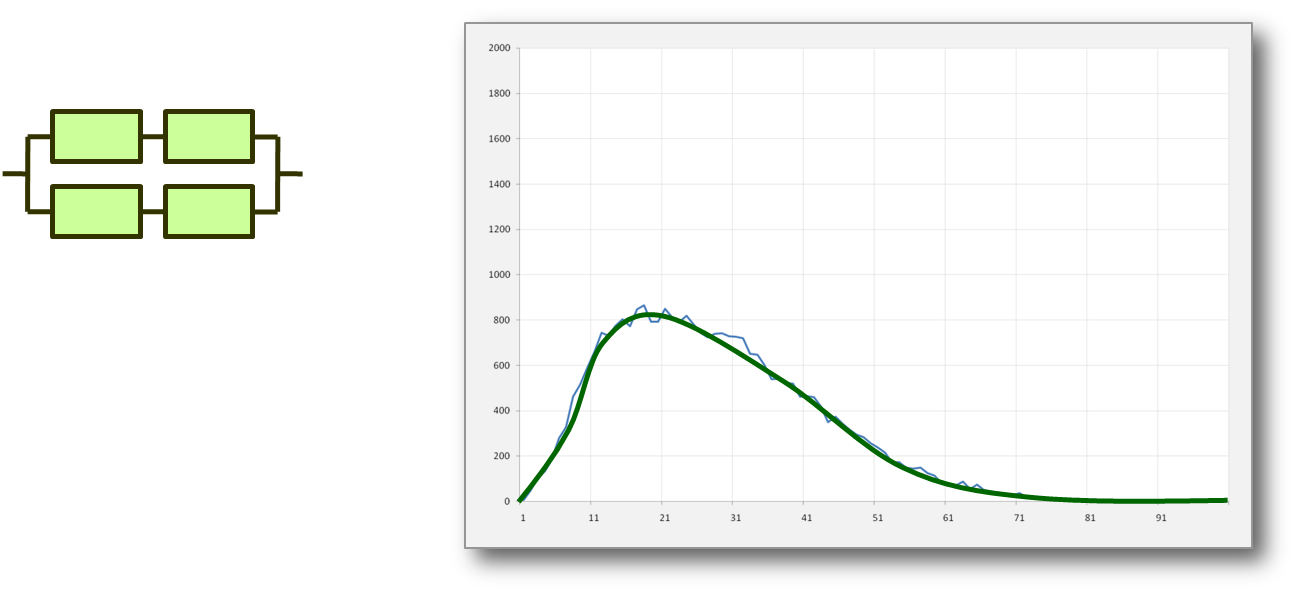
But the most commonly encountered situation is when we have a compromise, enough factors to give us a range of values, but not enough to make the result symmetric. This gives us the "Poisson Distribution", a form that can be adjusted between the Normal and Geometric depending on the relative frequencies of the events being studied.
This shows a more widely encountered probability distribution, for example encountered when the results have a minimum value (such as zero) but no maximum. For example the salaries of random people in a given population will look more like this.
Links to this page
There are no links to this page